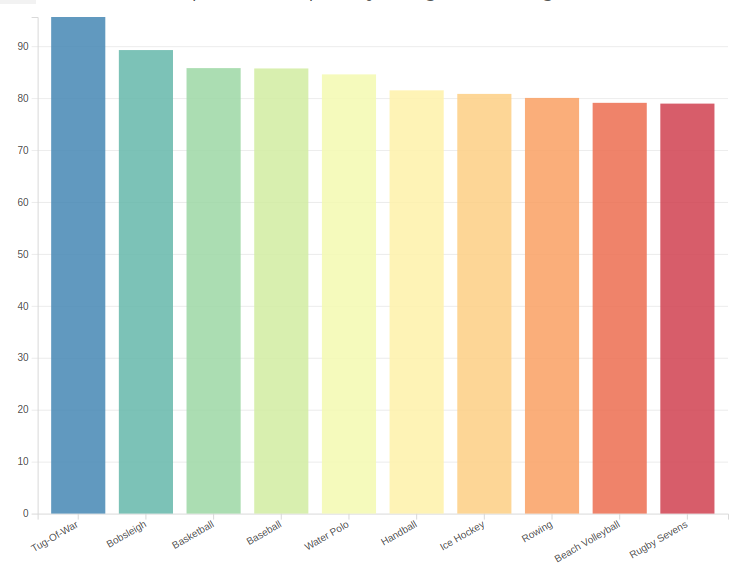
A column chart uses vertical bars to show different categories of data, each bar being the value of that category. They are effective for showing the value at a certain point in time and also to emphasize the difference between the values.
A column chart uses vertical bars to show different categories of data, each bar being the value of that category. They are effective for showing the value at a certain point in time and also to emphasize the difference between the values.