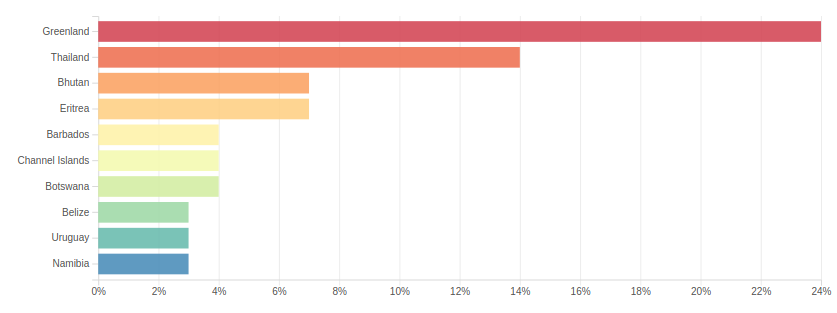
A bar chart, also known as a bar graph, is used in cases when you have different categories of data and want to compare their values.

A bar chart, also known as a bar graph, is used in cases when you have different categories of data and want to compare their values.