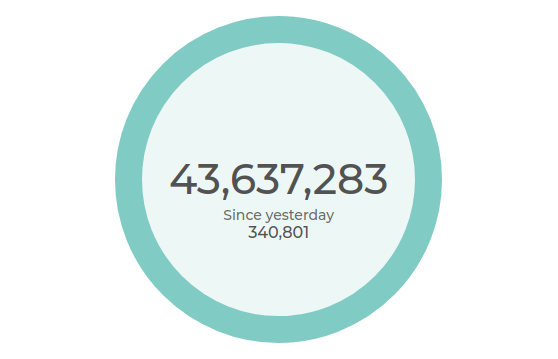
Also known as a single value chart as its name implies represents only one value, of any data type. You can show the sum of some values or just one distinct value that it’s important for your presentation. It can also show the value that was before or after some change happened and the value of the change itself.
