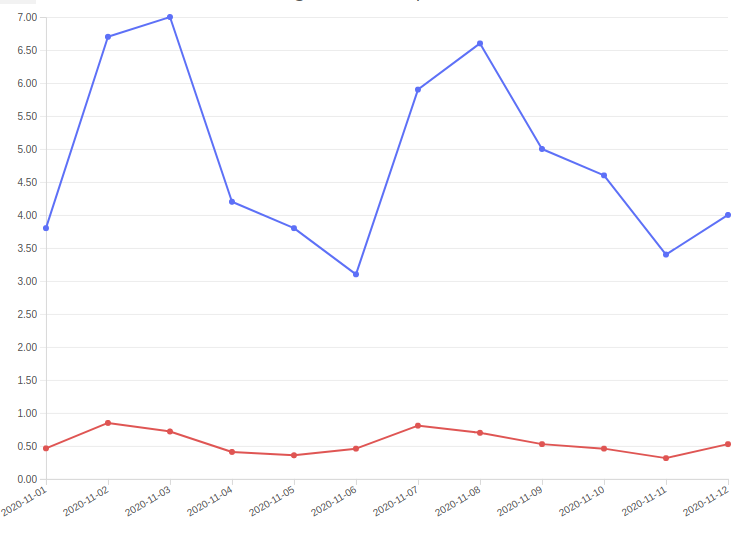
A line chart or graph is usually used to present the changes in data over some time period. The y-axis represents quantitative values, while the x-axis represents the time period during which the changes happened. It can also be used to present a correlation between two different variables, that can affect each other, and would be presented with two lines on the same graph. That would be done by adding the y1-axis on the other side of the graph, with the appropriate values shown on that axis.