For the last couple of years, the usual winter topic is air quality. Since during the summer there are a lot of greeneries, and plants are doing the cleaning, but also there’s no need for heating, we don’t think about the quality of the air we breathe in. All numbers are normal. But as the winter approaches, we face foggy weather and a high concentration of all sorts of pollutants. Even before this Covid-19 madness, every now and then there would be a recommendation to wear a mask if we go outside. But what exactly are those pollutants that harm us in the wintertime, and where do they go in the summer?
Types of pollutants
First of all, let’s go through pollutants and see what’s exactly in the air we breathe. The most “famous”, but also dangerous, are the particulate matters 10 and 2.5. Those particles are composed of sulphate, nitrates, ammonia, sodium chloride, black carbon, mineral dust, and water. There are two kinds measured: PM10, in which the number is a diameter of the particle in microns, and PM2.5, which means that the particle is so tiny it can end up in your bloodstream through your lungs. Just to compare, the hair from your head is 70 microns in diameter.
These particles end up in the atmosphere from combustion engines, solid-fuels (coal, lignite, biomass…), combustion in power plants for households, and also from mining and building and other activities which include breaking of the stones. And here we can see the beginning of the explanation of why pollution is much higher in the winter. All those households need heating and since it’s getting dark much earlier we use a lot more electricity than in the summer.
Combined with these particles, ground-level ozone becomes especially dangerous. As a secondary pollutant, it’s not directly emitted but it is produced when carbon monoxide (CO), methane, or other volatile organic compounds (VOCs) are oxidized in the presence of nitrogen oxides (NOx) and sunlight. Most of these emissions come from motor vehicle exhaust, industrial facilities, and chemical solvents, and also sources of methane are waste, fossil fuels, and agricultural industry.
Several more pollutants deserve at least a mention: nitrogen dioxide (NO2), sulphur dioxide (SO2), and carbon monoxide (CO). All these pollutants are directly linked with respiratory diseases and premature mortality rate.
Effect of the winter on European air quality
So, how is this affecting us mostly during the winter and why?
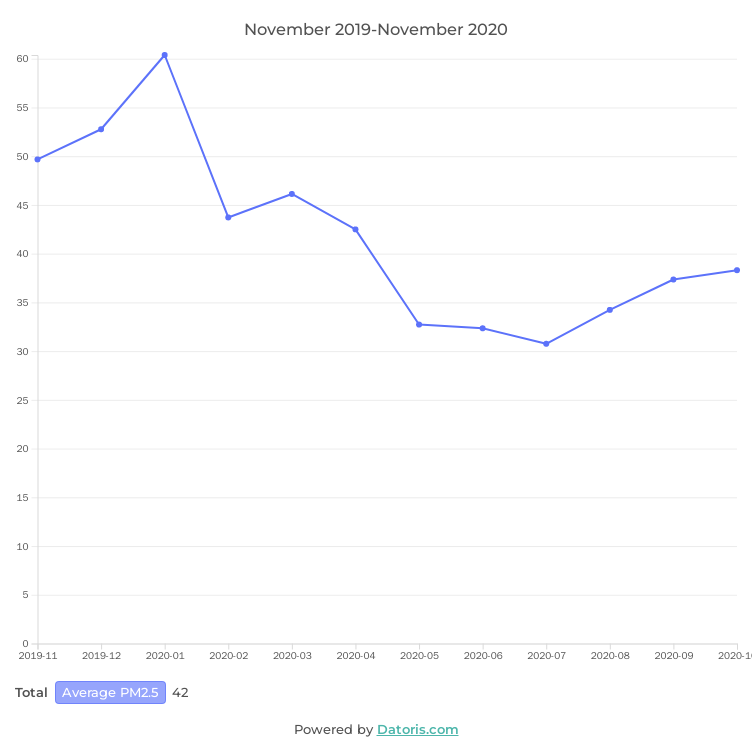
During the winter, days are shorter and temperatures are lower. With the lower temperatures, everyone heats up their home, whether they live in the cities and have central heating or live in the countryside and burn coal or wood, and also, people are using their cars more since it’s too cold for walking or cycling. In this chart, we can see that levels of PM2.5 (we monitored this particle because it’s more harmful than the others) in the winter months are much higher than in the summer months. As the summer approaches, we can see the pollution is getting lower and air safe for breathing again.
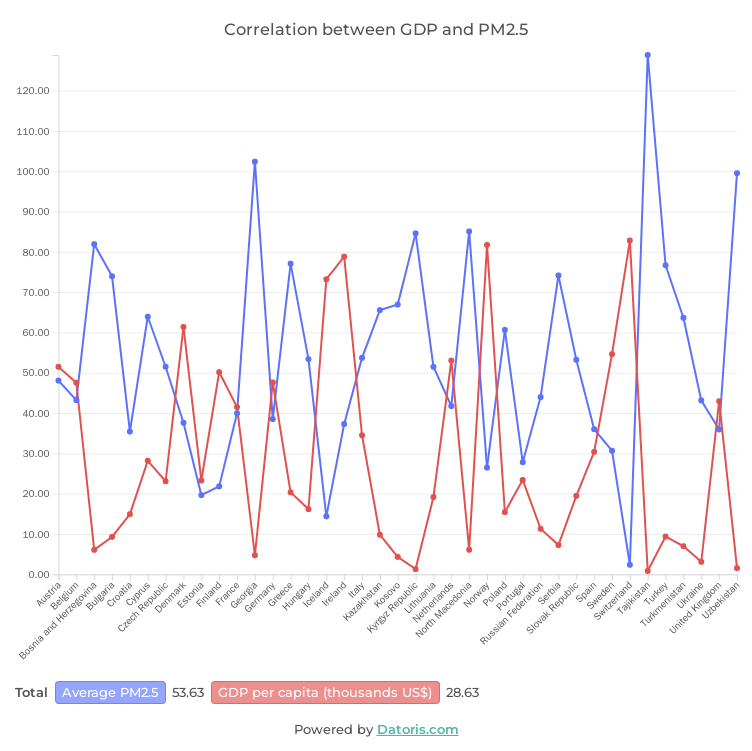
This case of high air pollution is especially visible in the Balkans and Eastern Europe. It can be explained with a lower standard of living, where many don’t have an opportunity to switch to central or gas heating, so they have to burn coal, wood, or something else which isn’t always the healthiest solution. Also, one of the reasons why this part of Europe has such low air quality index is the politics and economy in most of these countries. Many countries of this region let manufacturing companies from China open their factories there and although there are laws that set certain standards for air quality control, they are usually ignored and those companies are not checked regularly by the inspectors. In these charts below, we can see a correlation between GDP per capita and average PM2.5 in every country in 2019. In countries with high GDP levels of PM2.5 are low, probably due to high standards and strict ecological laws. The industry exists but the laws which are preventing ecological catastrophes are applied and respected by everybody.
This year, after a very foggy and smoggy winter, and many calls for citizens to wear masks because of the pollution, came Covid-19. At first, it seemed it would be like all the previous epidemics on a global scale, a little bit of scare talk, and then we continue with our lives as nothing happened. But in a few months since the first case, every country in the world knew about Covid19 and its consequences. So, looking up to China and its lockdown measures most European countries did the same. From March until May, most of Europe was under a lockdown, which means all the non-essential businesses were closed and everything transferred to the online sphere. This means people weren’t using cars that much, not having where to go anyway. So, we compared the air quality from the period 1st March - 30th May 2020 to the same period in 2019. And these are the results.
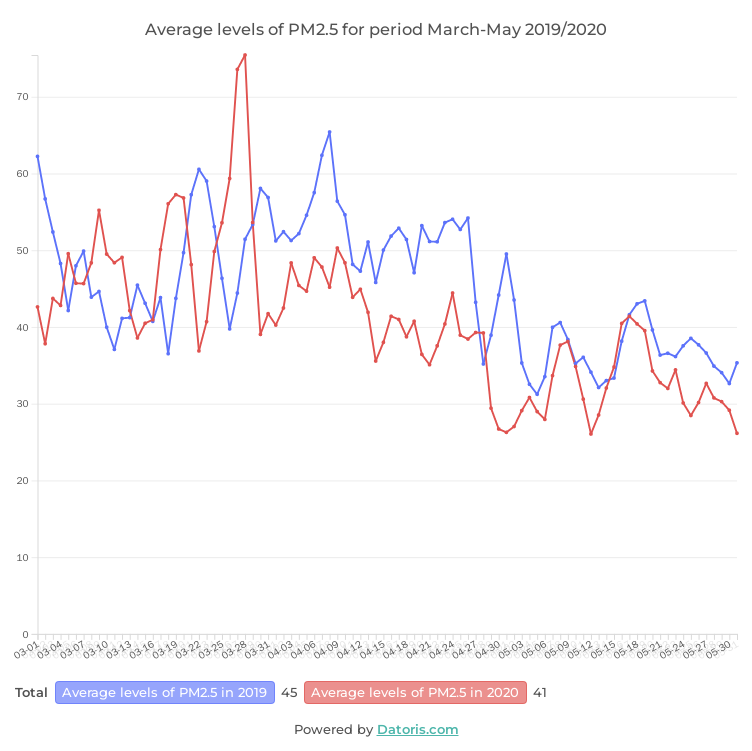
We used the results of the PM2.5 particle since the cars are one of the sources of this pollutant. Most of the countries imposed the lockdown from the beginning of March until some time in May. In this chart, we can see that for the first month of the lockdown (March) there was still noticeably higher pollution comparing to the same time last year, but then in April and May, we can see it's much lower. One of the reasons why pollution during March was still high could be the fact that it was still a bit cold and not all the countries imposed lockdowns at the beginning of March.
From these charts, it is visible that something could be changed regarding pollution levels. The ecological laws should be applied thoroughly and reduction of vehicles in bigger city centers is one of the ways to directly lower air pollution. One of the examples of positive impact on the environment is Vienna where the city center is a car-free pedestrian zone. As we could see from the lockdown period even the smallest changes can have a huge impact on our environment.
Sources: Air Quality Data, World Development Indicators