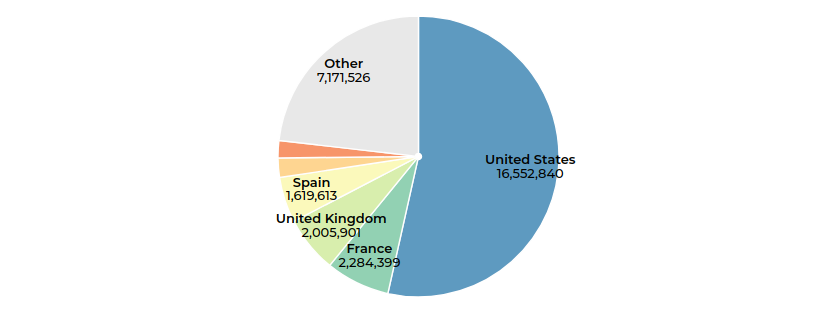
It’s a circular graph that shows portions of the whole (pie). It is used when you want to demonstrate different sizes of the same category which are comparable to each other. The size of every slice of the pie is proportional to the quantity it represents.