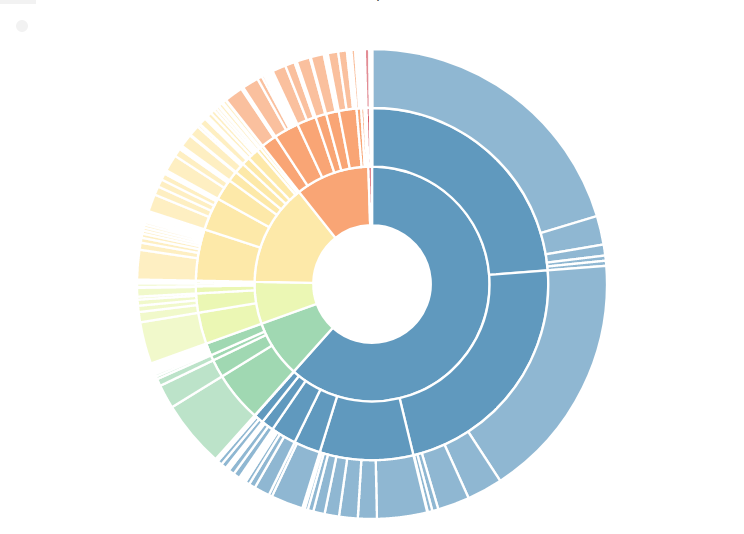
A sunburst chart (sunburst diagram) is a spherical chart used for representing hierarchical data separated into rings. The central circle is the root node, and moving outwards are the sliced rings corresponding to the parent slice (category). For a better visibility, it is recommended to use different colors for every slice, so even the outer rings are visible and differentiated.